How to Calibrate the Booth
This tutorial is a step-by-step introduction on how to calibrate the tubes and adjust them so that the walls have the same luminance as the monitor. We call this procedure ‘calibrating our booth.’ Most parts of this tutorial might only be interesting for people who actually work in our lab.
In order to do this just run Calibrate() for the color(s) you are interested in and it will perform the following steps and prompt you to change settings and press the i1 Pro button a lot. Since the monitor is black-and-white by color we mean the luminance values you are interested in.
Measure Monitor Color
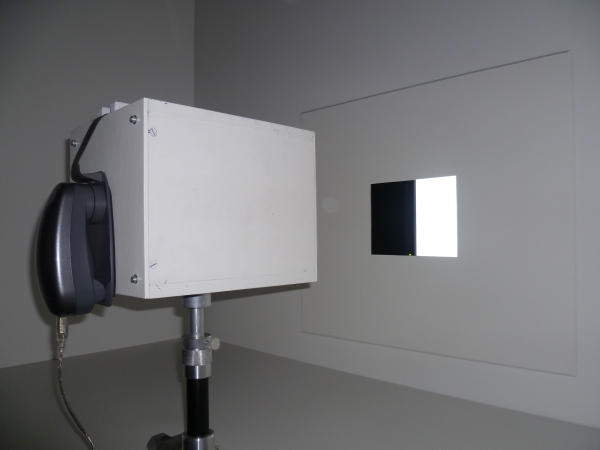
Setting for measuring luminance of monitor.
The very first step is to measure the color of the monitor through our measurement box. Make sure that you removed the piece that covers the cut-out in the wall, that the tubes are switched off, and that the room is completely dark.
We use a 10 bit black-and-white monitor (EIZO GS320) that displays 1024 different shades of gray. We usually refer to the monitor colors by numbers between 0 and 1023; 0 being the lowest luminance value and 1023 the maximum luminance.
You will be prompted to put the i1 Pro in measurement position and then press the button to start the measurement.
Luminance Functions
The next step is to find the luminance functions for the tubes. This means we want to find a function that connects the voltage we give to the tubes via the multifunction card (see hardware in Hardware and Equipment) with the luminance of the tubes. More precisely, we measure the luminance reflected by the wall when we adjust the tubes.
The tubes need to run for four hours before they reach a stable luminance (see Issues for more details and some graphs). This means if you want to do it perfectly, you have to measure the different color channels on three different days. Since the luminance functions only give you a starting point for the manual adjustment you can also measure them right after you switched them on.
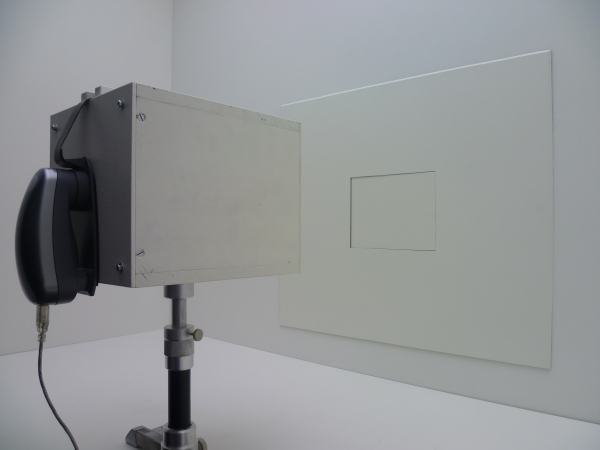
Setting for measuring luminance functions of tubes.
We close the cut-out in the wall and measure all three color channels separately. That means we will have to switch off the tubes of the colors we do not measure right now and that we will get three luminance functions: one for the red, green, and blue channel, respectively.
We fit a non-linear regression function (see [Pinheiro_Bates_2000]) to the data since it describes the relationship of voltage and luminance best.
Then, we determine the inverse function to get the correct voltage value for a certain luminance.
The parameters found for your current measurement will now be used to calculate the voltages for the tubes and they will be set accordingly. This will be our starting point which will be measured by the i1 Pro now.
Set Tubes Manually
You can now remove the cut-out piece again and look at the configuration. Probably the color of the monitor and the color of the wall do not match exactly. We have xyY coordinates for the monitor as well as for the tubes now (see CIE 1931 Color Space). They will probably also not be exactly the same. We can adjust this point by hand now (but make sure that all tubes have been running for at least 4 hours by now!). Put the cut-out piece back in and press the button. Adjust the tubes. You will get a new graph on the monitor for the experimenter after each adjustment. Stop when the red cross hits the blue cross on the left side and the cross lies on the line on the right side. On the left you adjust the xy color coordinates and on the right you adjust the brightness Y.
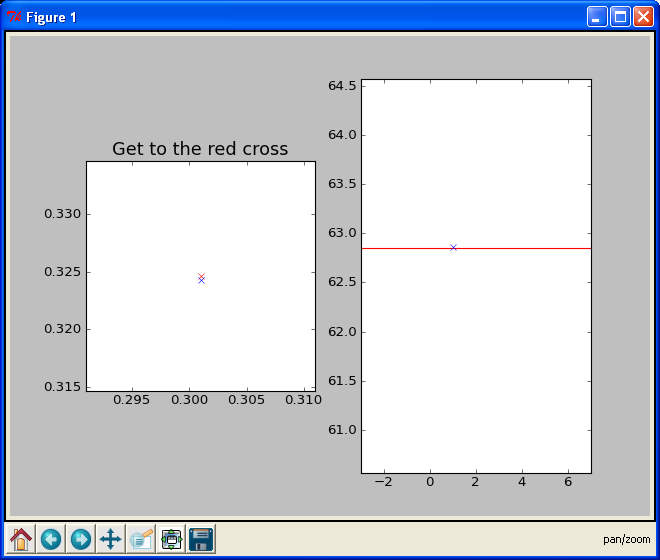
Interface for adjusting the tubes manually.
Now take out the cut-out piece again and look at it. If it still does not look right even though the colorimetric properties of wall and monitor are identical now, adjust by hand using your eye. So far, we always had to do this.
Get Color Table
This final configuration will now be saved as a colorentry object. You now have a color table that gives you the name of a color (between 0 and 1023), the corresponding coordinates in xyY color space, standard deviations for these three values, voltages for each channel (red, green, and blue), the corresponding xyY coordinates, and their standard deviations.
References
| [Pinheiro_Bates_2000] | Pinheiro, J. C. and Bates, D. M. (2000). Mixed-Effects Models in S and S-PLUS. New York: Springer |