Color Laboratory
The color laboratory belongs to Jürgen Heller’s research group Research Methods and Mathematical Psychology at the Department of Psychology of the University of Tübingen.
Our research group is interested in the characterization of the perceptual space of achromatic colors. Achromatic colors include black and white and all shades of gray. Traditional views assume that achromatic color perception is one-dimensional, meaning all grays can be assorted on a continuum from black to white. Recent empirical evidence and decades of theoretical work suggest that the perceptual space of achromatic colors is at least two-dimensional. In our project, we use mathematical models to describe the dimensionality of the perceptual space of achromatic surface colors.
The equipment of our color laboratory allows for presenting color stimuli via LCD/CRT displays under fully controlled illumination conditions generated by fluorescent tubes of different colors. We use traditional psychophysical paradigms like same-different judgments and midgray operation to address the following questions: What does the perceptual space of achromatic colors look like? More precisely: How many dimensions does the perceptual space of achromatic colors have? How are perceptual spaces for different illumination levels related to each other? Are they isomorphic (of the same structure)?
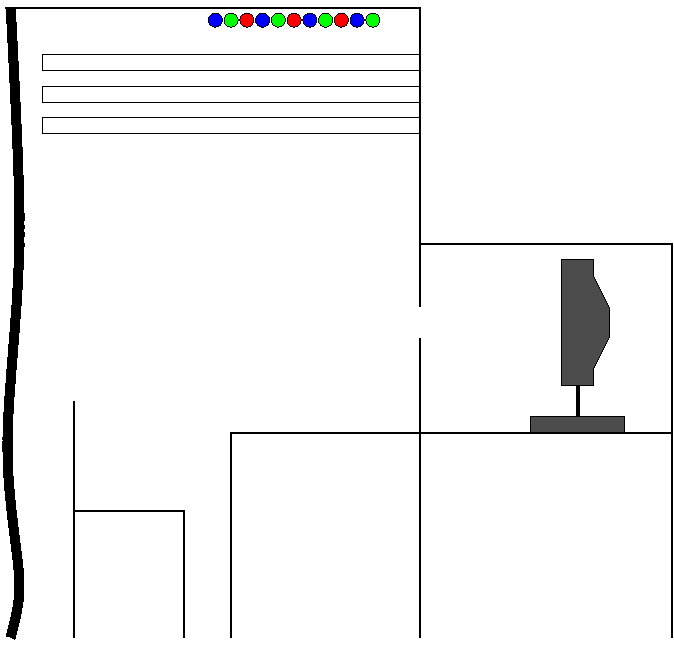
Schematic overview of color laboratory.
The walls in our color laboratory are painted white and can be illuminated by fluorescent tubes of different colors. Behind a small cut-out in the wall a monitor is mounted. The walls of the booth have the same luminance than the background of the monitor that we use to present stimuli. In order to run our equipment conveniently with one tool, we wrote the Python package achrolab.
Hardware and Equipment
Here is a list of the specific hardware and equipment we use in our color laboratory.
- Monitor: monochrome 21.3’’ Monitor EIZO RadiForce GS320 (high performance monitor for X-ray diagnostics, max. luminance \(1000 \frac{\mathrm{cd}}{\mathrm{m}^2}\))
- Graphics card: NVidia Quadro FX 1800. (See Issues on notes about what went wrong with our first graphics card and how and why we chose this one.)
- Tubes: four sets each with three Osram T8 fluorescent tubes red (58W / color 60), green (58W / color 66), blue (58W / color 67), dimmable, driven by multifunction card from wasco
- Multifunction card: the ADIODA-PCIF12 MDA (EDV No. A-407800) PCI multifunction card from wasco (old card: IODA-PCI12K4-EXTENDED), 12 bits
- Diffusion foil: diffusion filter 216 ‘White Diffusion’ by Lee Filters, neutral density filter 209 ‘3 ND’ and 210 ‘6 ND’
- Photometer: i1 Pro Spectrophotometer (max. luminance \(300 \frac{\mathrm{cd}}{\mathrm{m}^2}\))
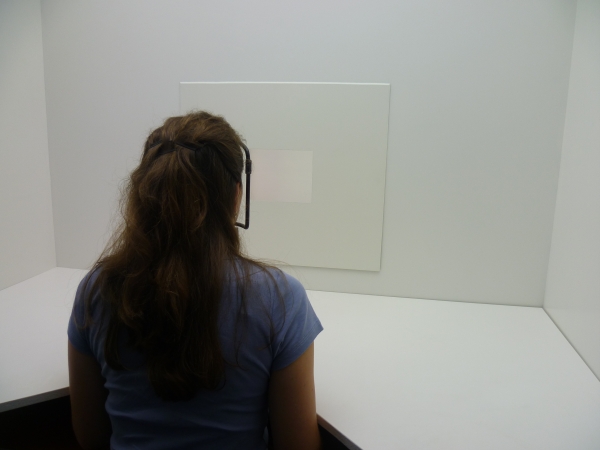
Picture of booth.
Walls
The walls are painted semi matte white with RAL 9010. They need repainting every once in a while since they bleach out due to the heavy light exposure.
Tubes
Here are some plots on measurements we conducted in order to characterize the behavior of the tubes.
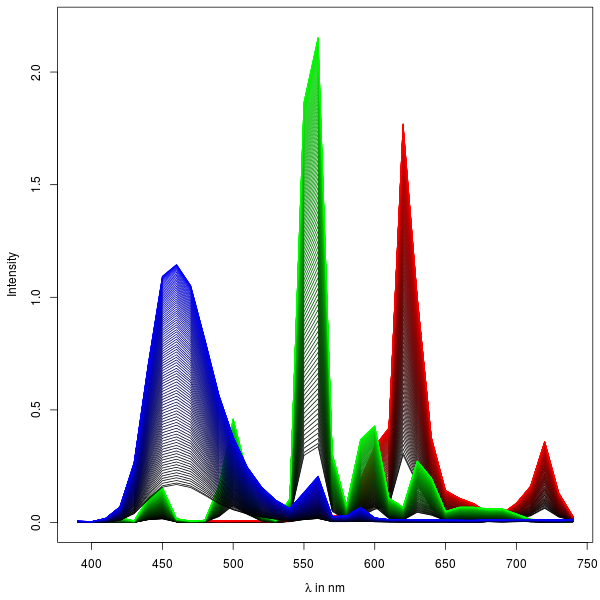
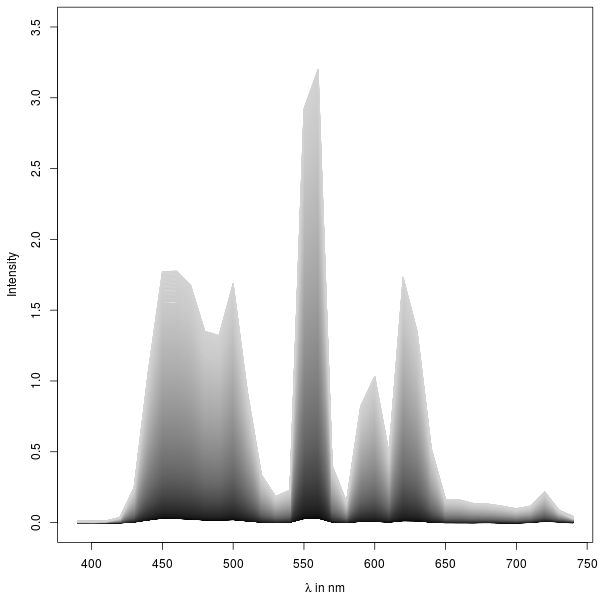
Spectra of red, green, and blue tubes from lowest to highest intensity.
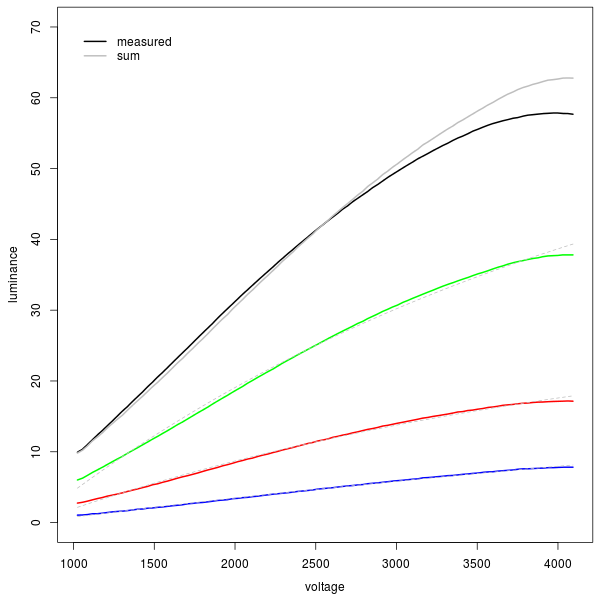
Luminance curves for red, green, and blue tubes and all tubes together.
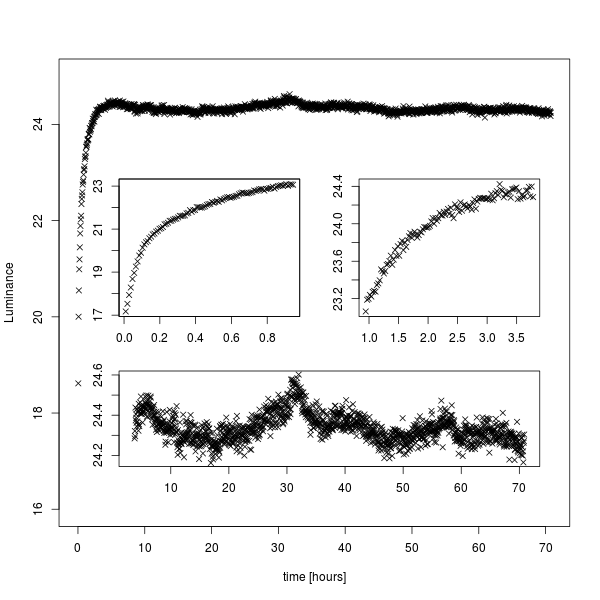
How luminance of tubes changes over time.
This last plot shows that the tubes have to run for at least four hours before they can actually be used in an experiment. It does not matter if they are warm or not. Once you turn them off (and that includes restarting the computer) you have to wait for four hours before you can continue working with the tubes.
Monitor
The monitor mode is set to the DICOM standard. This can be changed over the monitor dialogue. (See manual for EIZO GS320.)
Spectrum of our black-and-white monitor for comparison.
Spectrum of monitor (Eizo GS320) from lowest to highest intensity.
We had some trouble to actually present 1024 different shades of gray with this monitor, but managed eventually using a couple of workarounds. See Issues for details.
Multifunction Card
The multifunction card has four analogous outputs. The jumpers on the multifunction card are set so that the outputs have a range from 0 to 10 volts. The output DAOUT1 is used by the analogous inputs as reference voltage. The remaining three outputs control the dimmable tubes: red (DAOUT3), green (DAOUT1), and blue (DAOUT2).
Four of the analogous inputs connect to four control knobs. The control knobs can be used to adjust the tubes, while manually calibrating the setup. The pins on the plug CN1 are connected as shown in the following table.
| Function | Plug (CN1) | |
|---|---|---|
| Uref (10V) | DA 01 | PIN 33 |
| A6ND | PIN 68 | |
| Pot/All | AIN 63 | PIN 66 |
| Pot/Red | AIN 62 | PIN 32 |
| Pot/Green | AIN 61 | PIN 65 |
| Pot/Blue | AIN 60 | PIN 31 |
An example program to check inputs and outputs (ADIODA_PCIF12MDA.exe) and documentation can be found on the wasco CDROM. You check quick and easy if the card and the tubes are connected correctly.