Perceived Health Risk of Drugs
drugrisk.RdIn summer 2007, a survey was conducted at the Department of Psychology, University of Tuebingen. Hundred and ninety-two participants were presented with all 15 unordered pairs of the names of six drugs or substances and asked to choose the drug they judged as more dangerous for their health. The six drugs were alcohol (alc), tobacco (tob), cannabis (can), ecstasy (ecs), heroine (her), and cocaine (coc). Choice frequencies were aggregated in four groups defined by gender and age.
data(drugrisk)Format
A 3d array consisting of four square matrices of choice frequencies (row drugs are judged over column drugs):
drugrisk[, , group = "female30"]holds the choices of the 48 female participants up to 30 years of age.
drugrisk[, , group = "female31"]holds the choices of the 48 female participants from 31 years of age.
drugrisk[, , group = "male30"]holds the choices of the 48 male participants up to 30 years of age.
drugrisk[, , group = "male31"]holds the choices of the 48 male participants from 31 years of age.
Source
Wickelmaier, F. (2008). Analyzing paired-comparison data in R using probabilistic choice models. Presented at the R User Conference 2008, August 12-14, Dortmund, Germany.
Examples
data(drugrisk)
## Bradley-Terry-Luce (BTL) model
btl <- eba(drugrisk[, , group = "male30"])
## Elimination-by-aspects (EBA) model, 1 additional aspect
A1 <- list(c(1), c(2,7), c(3,7), c(4,7), c(5,7), c (6,7))
eba1 <- eba(drugrisk[, , group = "male30"], A1)
## EBA model, 2 additional aspects
A2 <- list(c(1), c(2,7), c(3,7), c(4,7,8), c(5,7,8), c(6,7,8))
eba2 <- eba(drugrisk[, , group = "male30"], A2)
## Model selection
anova(btl, eba1, eba2)
#> Analysis of Deviance Table
#>
#> Model 1: btl
#> Model 2: eba1
#> Model 3: eba2
#> Resid. Df Resid. Dev Df Deviance Pr(>Chi)
#> 1 10 24.942
#> 2 9 17.546 1 7.3961 0.006536 **
#> 3 8 11.454 1 6.0921 0.013579 *
#> ---
#> Signif. codes: 0 ‘***’ 0.001 ‘**’ 0.01 ‘*’ 0.05 ‘.’ 0.1 ‘ ’ 1
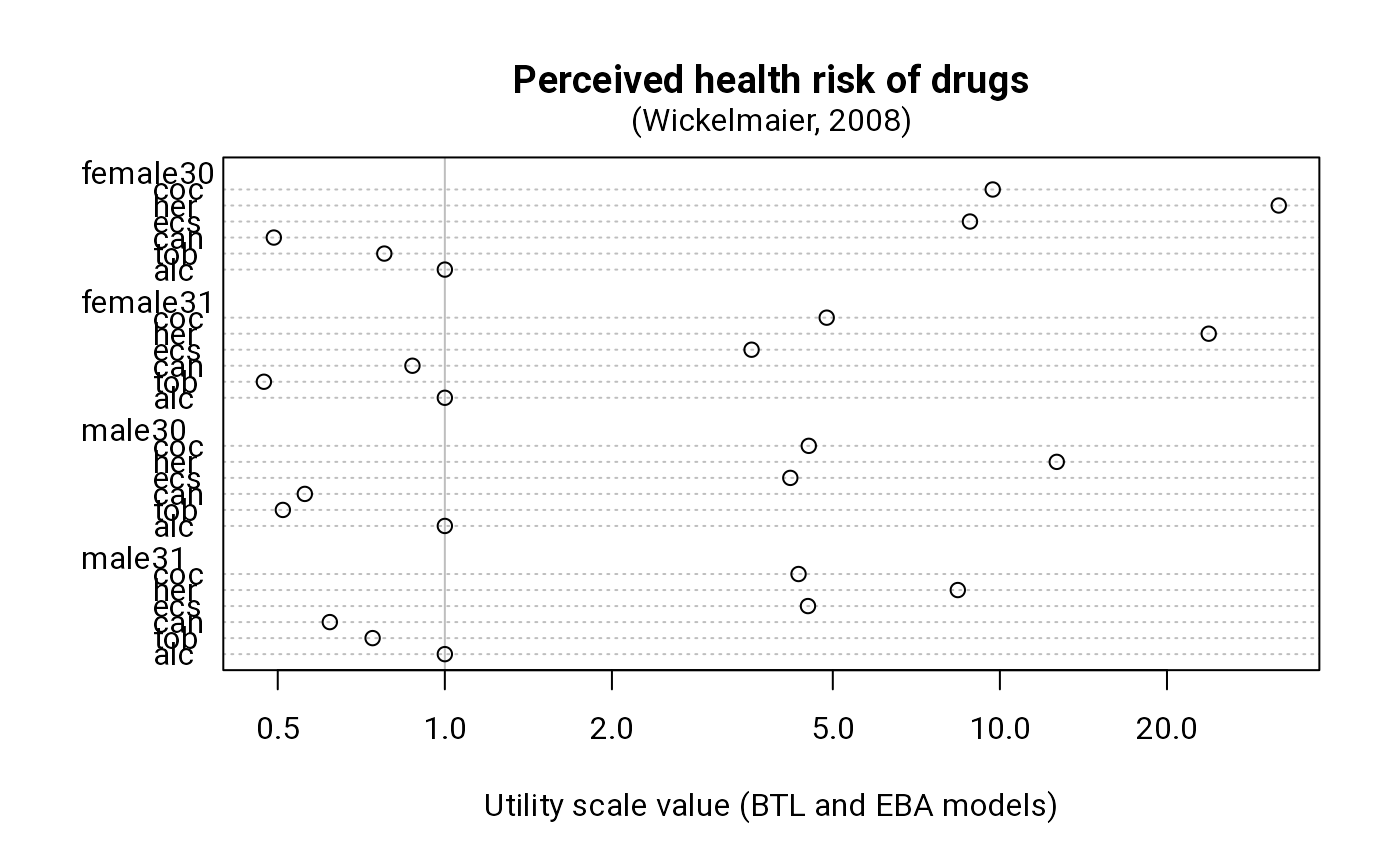
## Utility scale values (BTL for females, EBA for males)
dotchart(cbind(
apply(drugrisk[, , 1:2], 3, function(x) uscale(eba(x), norm = 1)),
apply(drugrisk[, , 3:4], 3, function(x) uscale(eba(x, A2), norm = 1))
), xlab="Utility scale value (BTL and EBA models)",
main="Perceived health risk of drugs",
panel.first = abline(v = 1, col = "gray"), log = "x")
mtext("(Wickelmaier, 2008)", line = 0.5)